Understanding results
Introduction
The goal of this document is to describe the way how stress test results should be interpreted in RadarGun. Artificial scenario of 2 different products (Product 1, Product 2) will be used with the following characteristics:
- Simple stress test (basic-operations-test) performing GET and PUT operations in ratio 4:1
- Test duration - 60s
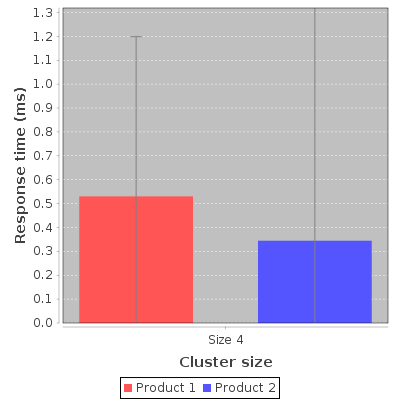
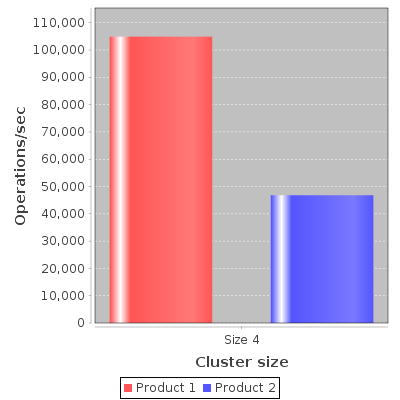
BasicOperations.Get
 |
 |
| Configuration stress-test | requests | errors | mean | std.dev | throughput |
|---|---|---|---|---|---|
| Product 1 / Cluster[default=4] | 6295856 | 0 | 530.13 us | 668.76 us | 104913 reqs/s |
| Product 2 / Cluster[default=4] | 2839287 | 0 | 344.5 us | 5.87 ms | 46816 reqs/s |
At first sight the results might look a bit confusing. How come Product 1 is able to achieve higher throughput than Product 2 (104913 reqs/s vs 46816 reqs/s), when the mean response time of Get requests is higher (530.13 us vs 344.5 us)? To understand this, we need to examine the results of Put operations at first.
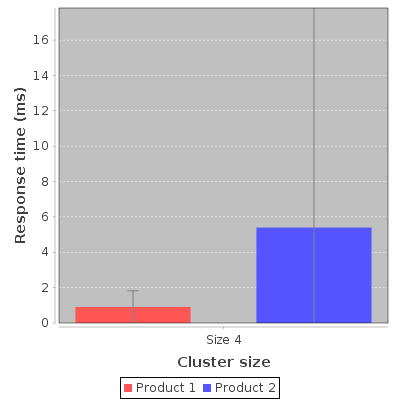
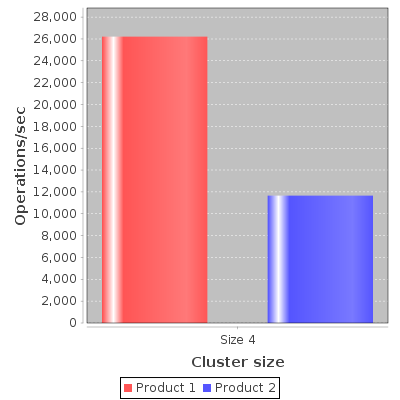
BasicOperations.Put
 |
 |
| Configuration stress-test | requests | errors | mean | std.dev | throughput |
|---|---|---|---|---|---|
| Product 1 / Cluster[default=4] | 1572984 | 0 | 906.56 us | 913.04 us | 26212 reqs/s |
| Product 2 / Cluster[default=4] | 707001 | 0 | 5.4 ms | 50.92 ms | 11657 reqs/s |
Product 1 was able to achieve higher throughput when performing Put operations (26212 reqs/s vs 11657 reqs/s). Put operations were also considerably slower than Gets for both products (Product 1 - Put: 906.56 us, Get: 530.13 us, Product 2 - Put: 5.4 ms, Get: 344.5 us). Important thing to notice here is that 4:1 Get:Put ratio is reflected in operation throughput (Product 1 - Put: 104913 reqs/s, Get: 26212 reqs/s, Product 2 - Put: 46816 reqs/s, Get: 11657 reqs/s). To proceed further, let’s have a look at how the results are calculated.
Throughput(operation) (ops/sec) = num_requests / test_duration (s)
e.g. Product 1 - Throughput(Put)
26212 reqs/s = 1572984 / 60
Response time mean (RTM)
Here we simply record how long it took the method invocation performing a request to return.
It’s obvious that RTM & throughput calculation are not related to each other. In previous versions we provided theoretical throughput, which was calculated as 1 / RTM, however this doesn’t reflect how many operations per second the product was actually able to perform, therefore we decided to drop it from the summary.
With this knowledge let’s get back to the Get results. The only way how Product 1 could achieve higher Get throughput with higher response time mean is with the help of fast Puts. Indeed, in this test Product 1 performed Puts 6 times faster (906.56 us vs 5.4 ms). As the operations (Get & Put) are performed one after the other, each time Product 2 spent considerable amount of time waiting for Put operation to return, Product 1 was able to perform multiple operations meanwhile. This is reflected in higher request count (Product 1 - Put: 1572984, Get: 6295856, Product 2 - Put: 707001, Get: 2839287). As the throughput is calculated based only on number of requests the product was able to perform (not RTM), this can lead to misinterpretation of the results.
Alternatives
- Calculate total throughput as a sum of partial results (Get/Put) to avoid confusion.
- If you’re in a need to calculate the performance of reads and writes separately, run a test exclusively with reads or writes. This can be achieved by tweaking get-ratio and put-ratio attributes of basic-operations-test stage (e.g. get-ratio=”1” put-ratio=”0” for read only test).